

Water is crucial for human and community development, playing a vital role in business manufacturing processes and supporting raw material suppliers. Its importance cannot be overstated: access to clean water, sanitation, and hygiene is essential for the health of people and ecosystems, the sustainability of communities, and the growth of the economy.
Impact, risk, and opportunity management
In early 2025, we kicked off our nature development program as described in the Biodiversity and ecosystems section. The outcome of this program helped us to develop our approach to nature, as detailed in this section and the next, focusing on tackling key nature-related challenges across our business.
To ensure that we followed a rigorous process consistent with ESRS, the assessment of our nature DIROs was performed in line with the LEAP approach of the Taskforce for Nature-Related Financial Disclosures (TNFD) and followed best practices from SBTN. A full overview of definitions, methodology, and findings is available in the Biodiversity and ecosystems section.
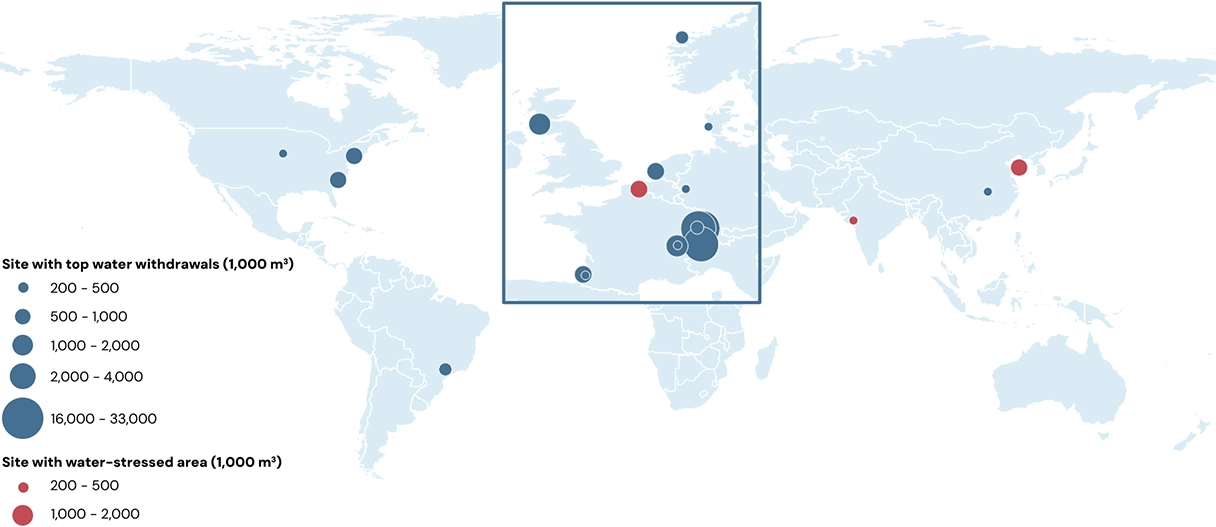
The DIROs are managed through our internal overarching DIRO management approach, which ensures that the DIROs are digested, monitored, and have appropriate follow-up at a minimum yearly frequency. This approach also ensures integration into our ERM Framework, allowing the business to highlight where aspects of the strategy may be at risk and where risk mitigation efforts are required. While the majority of our water withdrawal does not occur in areas with high water stress (4% of our total water withdrawal occurs in areas with high water stress, as illustrated further on in this section), a proportion of it may be impacted by water stress or have an impact on water stress. This can occur in two ways:
Several of our operations processes rely on water: when such operations occur in water-scarce areas, this could impact freshwater availability
Regulations on water withdrawal are generally becoming stricter, mainly in areas with water stress: permit levels may become more restrictive, which can lead to costly water efficiency upgrades
Our policies reflect how important responsible water use is in our production sites and supply chain, along with the importance of regularly assessing our water risks. They also highlight the importance of ensuring access to clean water, sanitation and hygiene (WASH) in our operations and in selected high water-risk communities in our value chain. Our policies do not currently specifically address water in the context of product design.
Our water stewardship approach
Within our own operations, our approach to reduce our impact and risk with respect to water relies on four main pillars:
We evaluate and mitigate water-associated risks. This is supported by the implementation of water risk screening and water risk assessments
We continuously improve the water efficiency of our operations, focusing first on our sites in water-stressed areas. This is driven by a company target to improve water efficiency by 10% between 2023 and 2030 for our sites in water-stressed areas
We evaluate the impact of our projects on the environment, including water when material, consider the integral price of water in business case evaluation, and strive to maximize water re-use and recycling
We follow WASH principles at our manufacturing sites
These principles were formalized in 2025 in our standard for sustainable operations and environment. Our overall commitment extends beyond our immediate operations. We regularly assess the future availability of water in high-risk catchments and evaluate the environmental and social risks associated with our water usage. By actively participating in initiatives and forming partnerships, we aim to drive significant progress in water stewardship, ensuring a sustainable future for all.
Actions and resources
To deliver on our water target, the same principles as for our Scope 1 & 2 GHG roadmap development are applied, including the following:
We identify site improvement opportunities by performing site assessments with water experts
We deploy sustainable technologies (e.g., dashboarding and monitoring)
The resulting roadmap is continuously improved to ensure that the best solutions are implemented, considering also the local water challenges. In 2025, water roadmaps were developed in several sites, such as Chifeng (Inner Mongolia, China), Seclin (France), and Port Newark (New Jersey, USA).
Various types of solutions will be implemented, including water efficiency measures such as leakage reduction, cooling tower optimizations and reverse osmosis optimization, but also, to a lesser extent, water recycling options (e.g., implementing more closed loop systems, wastewater effluent recovery).
In 2025, we implemented several projects around the world, delivering, for example, a significant improvement of the recovery rate of our reverse osmosis system in Chifeng (Inner Mongolia, China), and the improvement of steam distribution in Port Newark (New Jersey, USA) reducing steam and consequently water losses. The resources needed to achieve these water improvements are factored into our regular operational improvement program.
Metrics and targets
Our water target
At the end of 2024, a new company target was established: a 10% improvement in our water efficiency between 2023 and 2030 for manufacturing sites located in water-stressed areas.
This target was defined considering external developments around water stewardship, including:
The importance of reducing water withdrawal and aligning with, among other things, the Science-Based Target Network (SBTN) framework development
The importance of focusing on areas with the highest water stress, as defined by, for example, the World Resources Institute (WRI) and the World Wildlife Fund (WWF)
In 2025, we achieved an 11% water efficiency improvement compared to 2023 for sites in water-stressed areas, slightly above our 2030 target. This was due to the realization of water savings as described above, product intensification in a few sites, and product mix changes in one of our ANH facilities. After the carve-out, we expect water efficiency improvement to also be positive although below the target level, confirming the value of this target to keep driving company water improvements.
Sites representing 95% of total dsm-firmenich water withdrawal and in scope for water reduction activities
Water use
(x 1,000m3) |
|
2025 |
|
2024 |
||||||
|---|---|---|---|---|---|---|---|---|---|---|
Total water withdrawal |
|
100,350 |
|
103,600 |
||||||
– Fresh surface water (OTC) |
|
77,000 |
|
80,700 |
||||||
– Fresh surface water (non-OTC) |
|
5,500 |
|
5,500 |
||||||
– Fresh ground water |
|
6,200 |
|
6,200 |
||||||
– Brackish water/sea water1 |
|
300 |
|
300 |
||||||
– Third party source |
|
10,400 |
|
10,000 |
||||||
– From processing of raw materials1 |
|
250 |
|
230 |
||||||
– Material collected rain water1 |
|
700 |
|
670 |
||||||
|
|
|
|
|
||||||
Total water discharge |
|
94,800 |
|
98,250 |
||||||
– to environment (OTC) |
|
77,000 |
|
80,700 |
||||||
– to environment (non-OTC) |
|
8,500 |
|
8,050 |
||||||
– to fresh surface water |
|
7,000 |
|
6,500 |
||||||
– to brackish water/sea water1 |
|
1,200 |
|
1,190 |
||||||
– to ground water1 |
|
300 |
|
360 |
||||||
– to offsite treatment (3rd party destinations) |
|
9,300 |
|
9,500 |
||||||
|
|
|
|
|
||||||
Water consumption1 |
|
5,400 |
|
5,300 |
||||||
– in water-stress areas1 |
|
1,260 |
|
1,380 |
||||||
|
|
|
|
|
||||||
Water consumption intensity2 |
|
0.43 |
|
0.41 |
||||||
|
||||||||||